
US aluminium jobs and economic impact steady through Covid-19

Image: Shutterstock
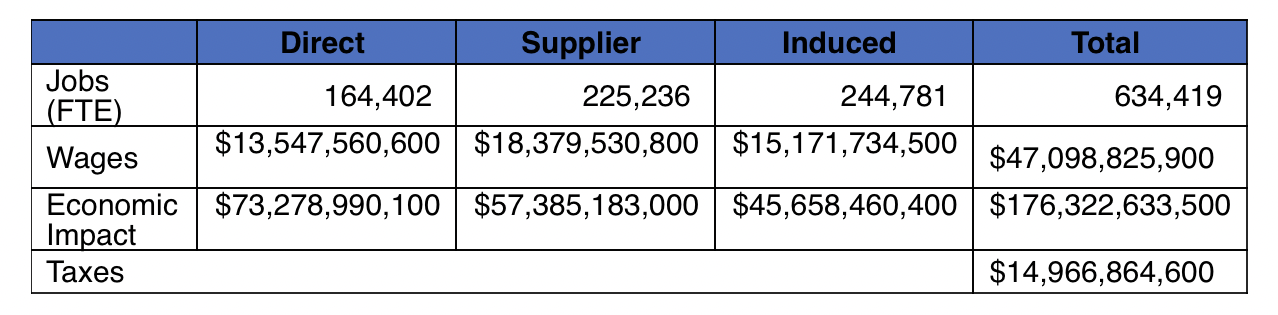
A new study shows that the US aluminium industry directly employs more than 164,000 workers and drives US$73 billion in direct economic output. Overall employment in the domestic aluminium industry has been largely steady for most of the past decade, though jobs overall did decline slightly between 2020 and 2022 studies. In total, the US aluminium industry supports more than 634,000 direct, indirect and induced jobs and nearly US$176 billion in economic output. The 2022 Economic Impact of the Aluminum Industry study was completed by economic research firm John Dunham & Associates in March 2022 (with the impact data finalised in January 2022). The report uses standard econometric models first developed by the US Forest Service and now maintained by IMPLAN, Inc.
US aluminium industry economic contribution 2022
Graph: The Aluminum Association
Estimated aluminium demand in North America was up 7.7% year-over-year in 2021, significantly outpacing US GDP growth. In the past year, the industry has collectively committed or invested nearly US$1 billion in US manufacturing – adding to the more than US$4 billion invested over the past decade. The international picture is also positive: the International Aluminum Institute recently released a report developed by CRU Aluminum, projecting that aluminium demand will grow by nearly 40% globally by 2030 – with significant growth in North America.
“We’re incredibly encouraged by the position of the US aluminium industry today,” said Charles Johnson, president & CEO of the Aluminum Association. “Like all manufacturers, we faced some headwinds during these uncertain times, but our underlying demand and investment picture remains quite robust. This is a resilient sector of the American manufacturing economy.”
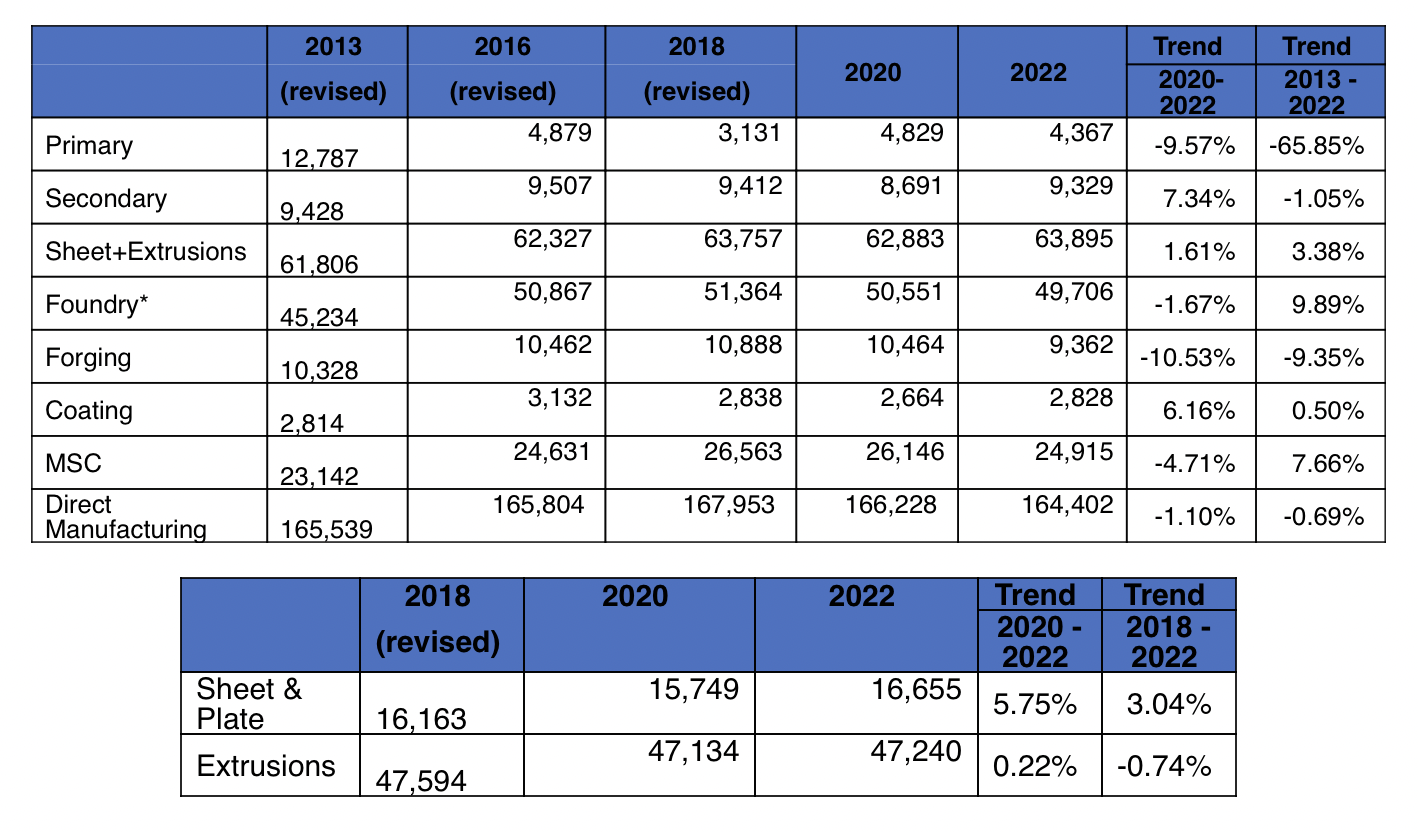
Certain segments of the industry thrived while others were challenged amidst Covid-19 driven disruptions over the past two years. Secondary aluminium production (recycling) (+7.3%); aluminium coatings (+6.2%); and sheet & plate (+5.8%) jobs all increased notably between 2020 and 2022.
After showing signs of improvement in the 2020 study, primary aluminium production (-9.6%) jobs declined with some plant closures and curtailments occurring during the period. Jobs in aluminium forging (-10.5%) also dropped by more than 10% between these studies, likely due to Covid-driven declines in major markets like aerospace. Taking the long view, US aluminium jobs have stayed essentially flat over the past decade, despite the loss of more than 8,000 jobs in primary aluminium production – a 65% decline.
US aluminium industry jobs by sector: 2013- 2022
Graph: The Aluminum Association
“These trendlines are an indication of US aluminium’s ability to adapt and innovate. Even as we’ve seen declines in some areas, we’ve seen notable growth and investment in others,” added Johnson. “At the end of the day, America remains one of the best places in the world to invest in aluminium.”
Today’s report is an update of a study completed in 2013, 2016, 2018 and 2020. Data from prior years’ studies have been reviewed and updated for accuracy, providing the most up-to-date and comprehensive information on the US aluminium industry’s economic impact.
Other key findings in the report include:
- Workers directly employed by the US aluminium industry earn more than US$13 billion in wages and benefits.
- Indirect and induced employment creates an additional US$33 billion in wages and benefits.
- When all employment supported by the industry is taken into account, these jobs generate nearly US$15 billion in federal, state and local taxes.
For the purposes of the report, the aluminium industry is defined to include alumina refining; primary aluminium smelting; secondary aluminium production; manufacturing of aluminium sheet, plate, foil, extrusions, forgings, coatings, and powder; aluminium foundries; metals service centers, and wholesalers. The study measures the number of jobs in this industry, the wages paid to employees, total economic output and federal and state business taxes generated.
The complete study, including an interactive map with economic contribution breakdowns by state and congressional district, is available at www.aluminum.org/economy.
TopicsPeopleOrganisations
Aluminum Association International Aluminum Institute John Dunham & Associates
Regions


